Real-time monitoring
Readings every 10 minutes, from the sensor in the plot straight into the dashboard.

Sensors on LoRaWAN, a solar gateway with nine days of autonomy and a platform that turns measurements into irrigation decisions.
7
Agro-meteo parameters
From a single compact station
9days
Gateway autonomy
No sun, no grid connection
10min
Measurement interval
From the sensor to the dashboard
Readings every 10 minutes, from the sensor in the plot straight into the dashboard.
Kilometres of range with no SIM, no cable and no mobile data subscription.
Solar gateway and battery-powered sensors. Installation does not depend on the grid.
The same data on phone, tablet and laptop, from the field or from the office.
Threshold crossed, email notification. Official ANM warnings included.
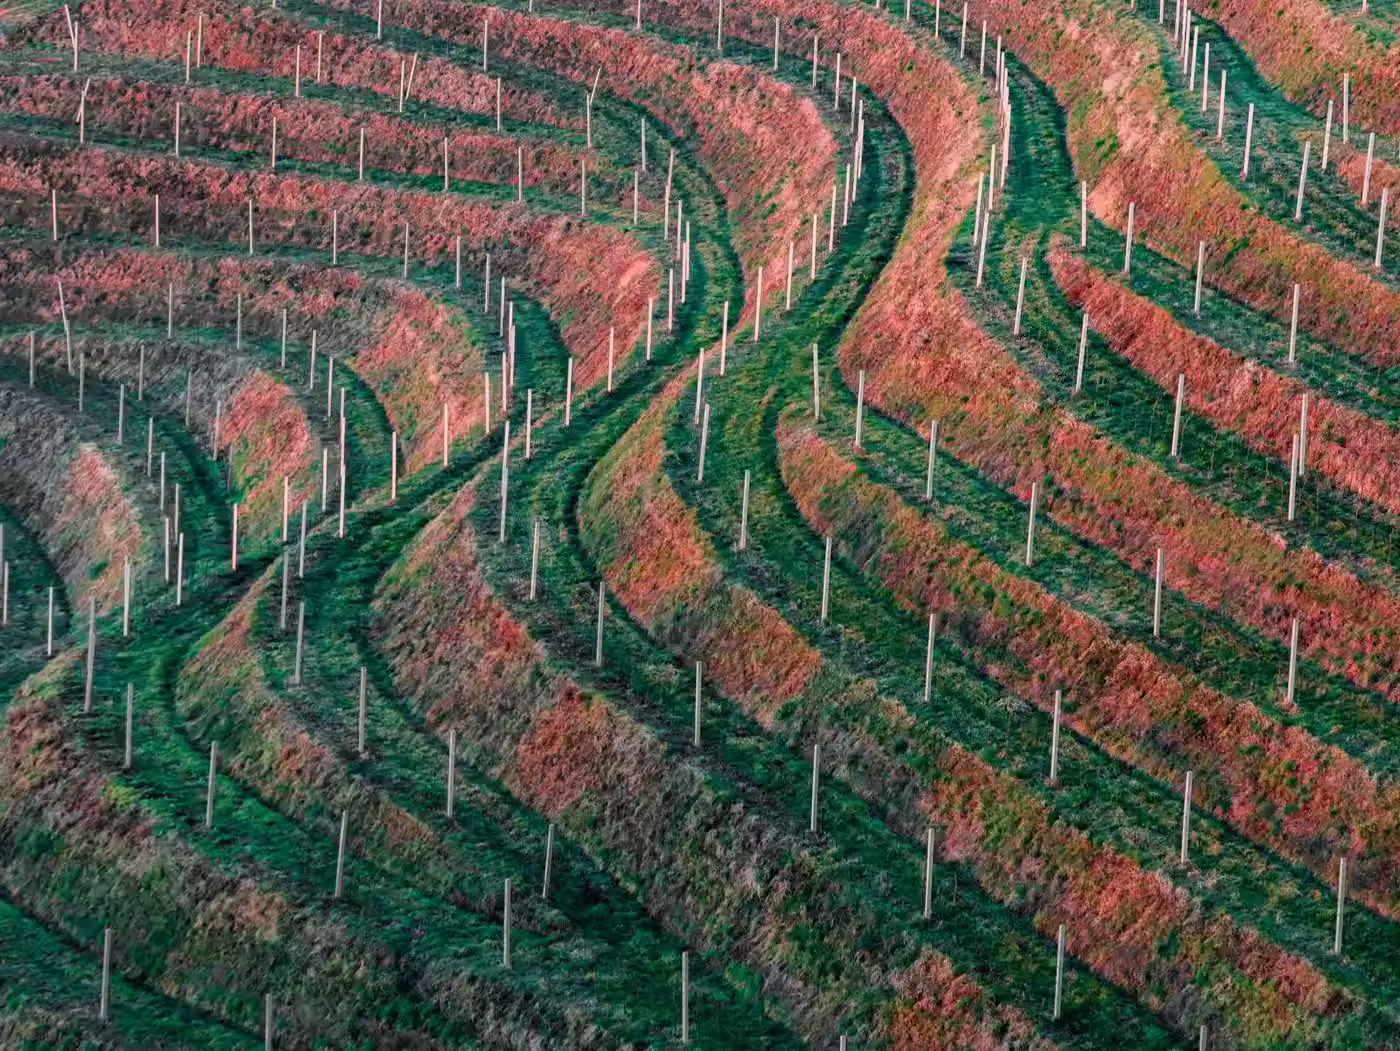
The same plot, different zones. The top of the hill and the base of the slope do not behave alike, and a single farm-wide average hides both.
A regional forecast is right about the region and wrong about your field.
Regional forecasts are correct for the region and wrong for your plot.
Without local measurements, watering follows habit. Either you spend water you did not need, or you notice the stress after the yield is already affected.
On a slope, cold air pools at the bottom. A regional minimum of 2 °C can mean -1 °C in the lower rows, and nobody tells you in time.
A sensor that only draws a chart is a cost. What you need is interpretation: how much water is missing, how the drought index is trending, what to do this week.
Air, soil, rainfall, wind, UV and derived indices, each with its own history and thresholds. Switch the station and watch the readings change.
Four steps, one single path for the data. Nothing in the chain needs mains power in the plot.
SenseCAP devices in the plot read air, soil and rainfall every 10 minutes and transmit over LoRaWAN. Kilometres of range, years of battery.
A solar-powered MikroTik gateway collects the packets and pushes them into ChirpStack. No mains power, no wired internet.
Measurements are combined with the Open-Meteo forecast and the nearest official ANM station, then become ET₀, VPD, water balance and drought indices.
A dashboard per plot, email alerts when a threshold is crossed and weekly agronomic recommendations with a stated severity.
No roadmap items presented as features.
Four tabs: Now, Sensors, Metrics, Forecast. Station picker, alert banner, sensor health with signal and battery, rainfall and hourly forecast side by side.
48 hours hourly and 7 days daily, plus what agronomy needs: ET₀, vapour pressure deficit, solar radiation, dew point, sunrise and sunset.
Per zone: drought level, rainfall against cumulated ET₀, the current year against the multi-year average, plus SPEI-30, KBDI, heat days and tropical nights.
A rule engine turns the indices into concrete advice, each one tagged and split into farm-wide recommendations and recommendations for a specific zone.
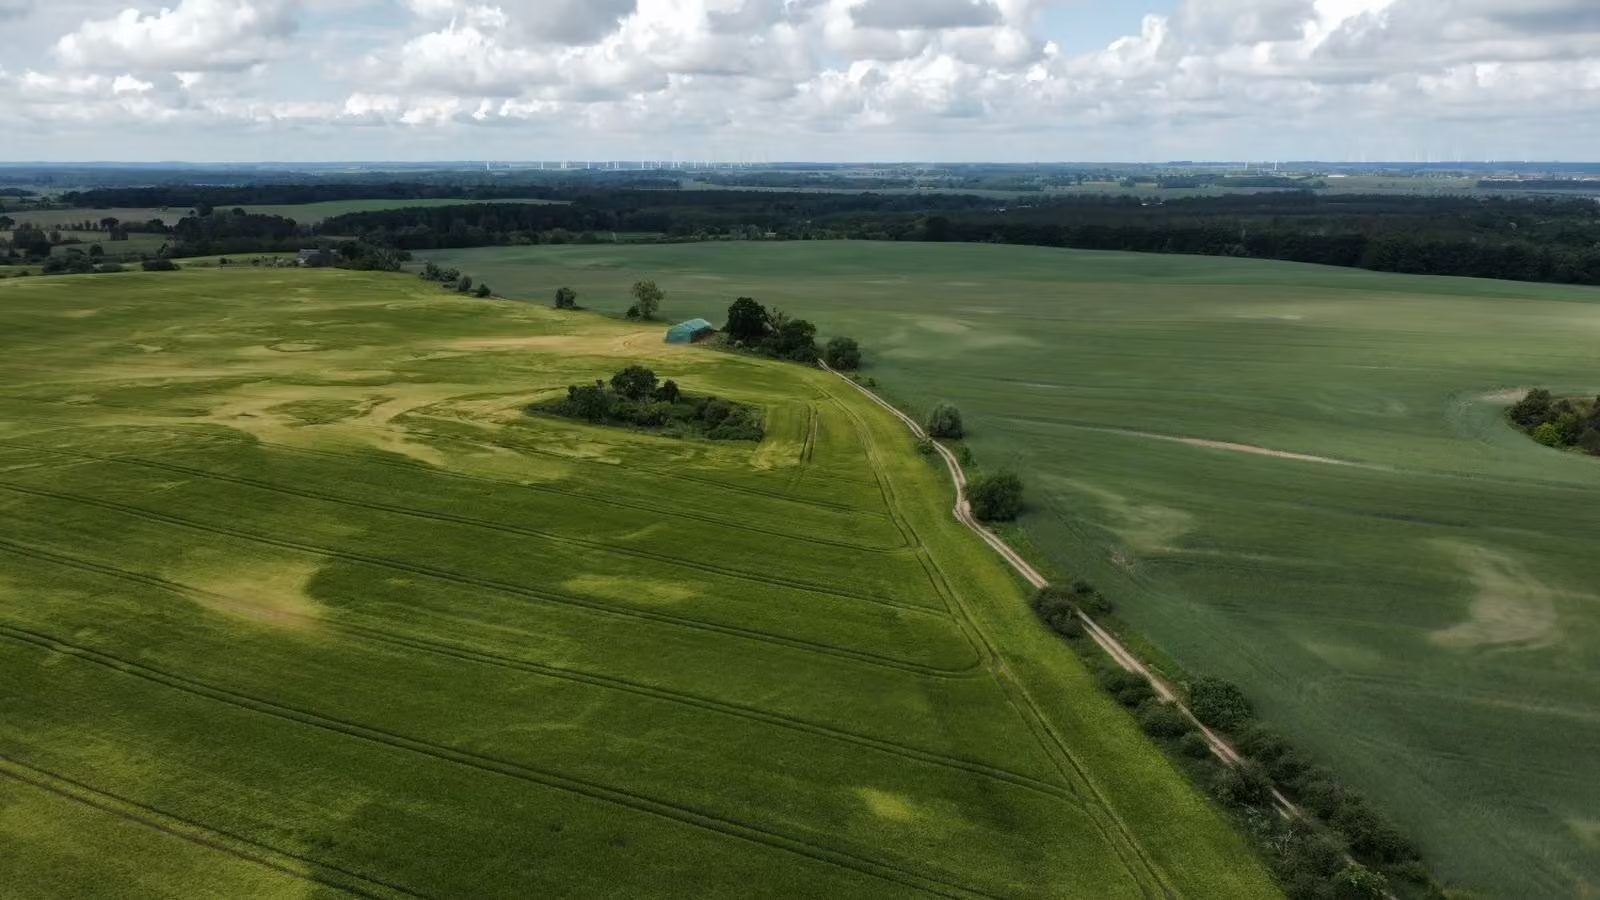
You draw the plots, place the sensors on the map by dragging, and read each zone by its own geometry rather than by a single farm-wide average.
Configurable rules with your own thresholds and severity, email notification, acknowledgement and history, merged with the official meteorological warnings issued for your area.
SenseCAP equipment from Seeed Studio only. One vendor, one LoRaWAN stack, one spare-parts list.
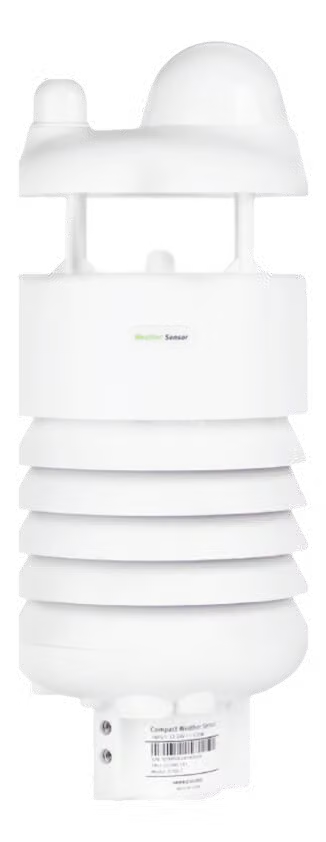
Seven agro-meteorological parameters in one compact housing, with a radar rain gauge and a pyranometer. This is the station we put on a plot when there is only room for one instrument.
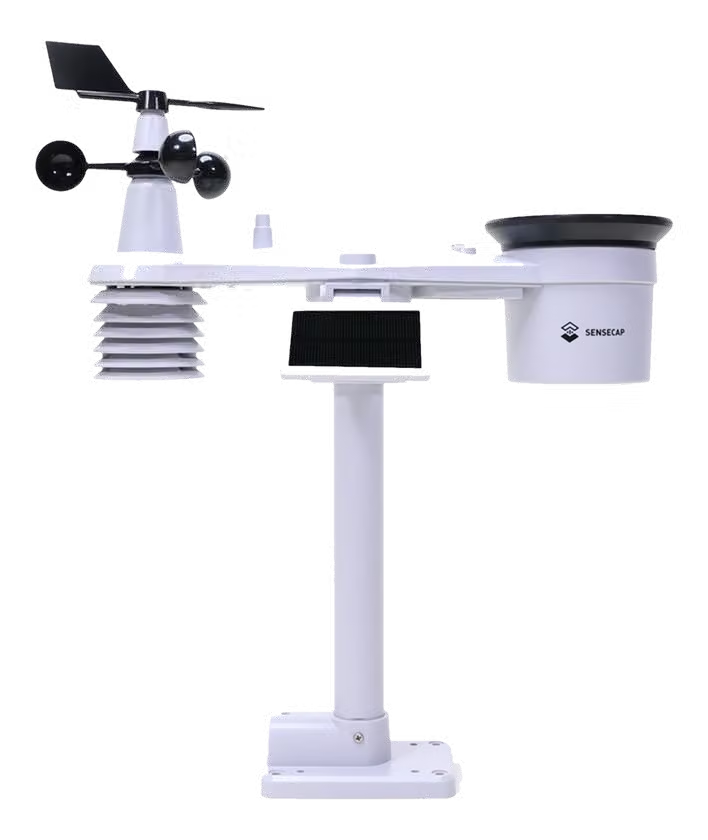
A complete weather station that speaks LoRaWAN directly, with no separate data logger. The pragmatic choice when you want several measurement points rather than one very good one.
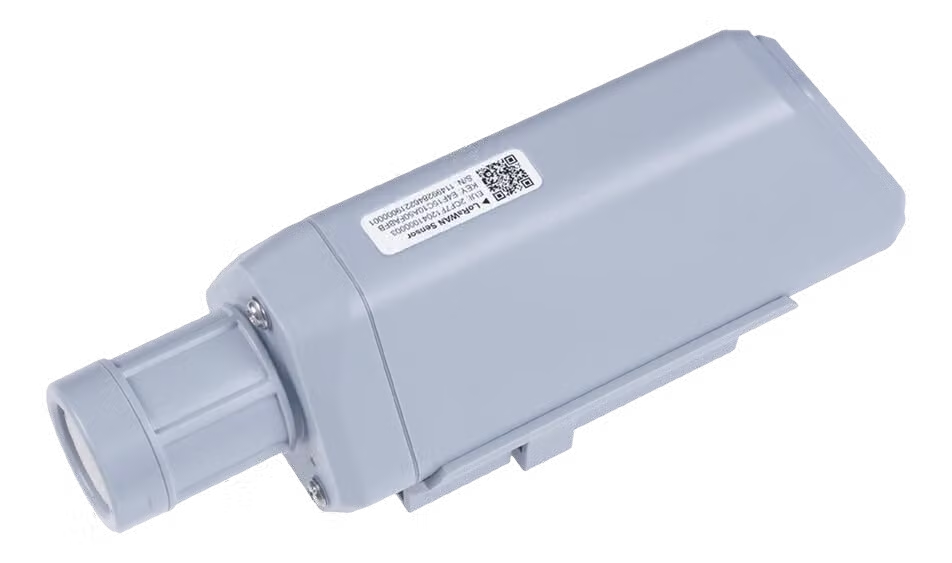
The sensor you place where the weather station cannot reach: inside the canopy, at the bottom of the slope, in the greenhouse, in the storage room.
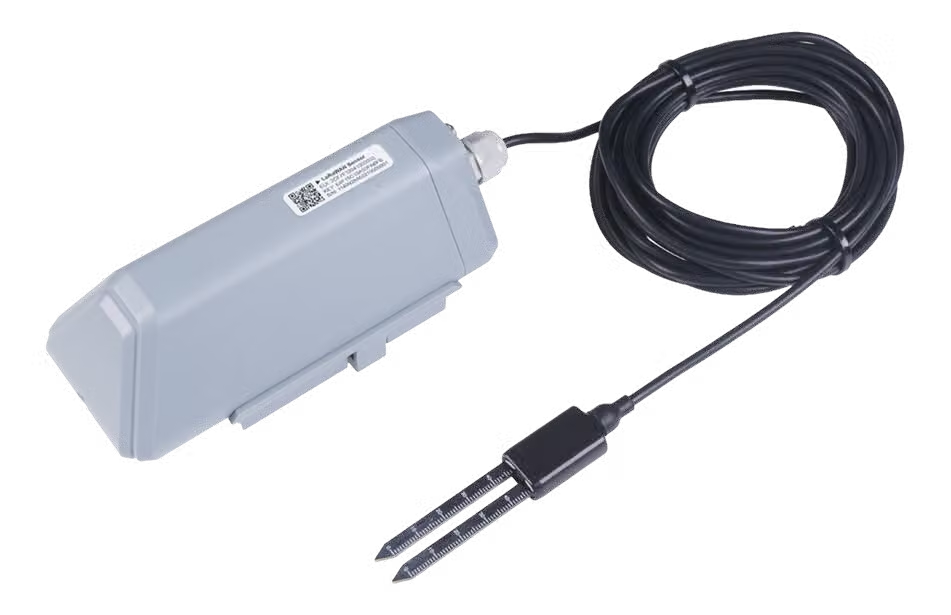
The soil probe that closes the water balance. Without it you know how much rain fell; with it you know how much of it is still there.
The same measurements, different thresholds. Every crop has its own set of rules and its own zone on the map.
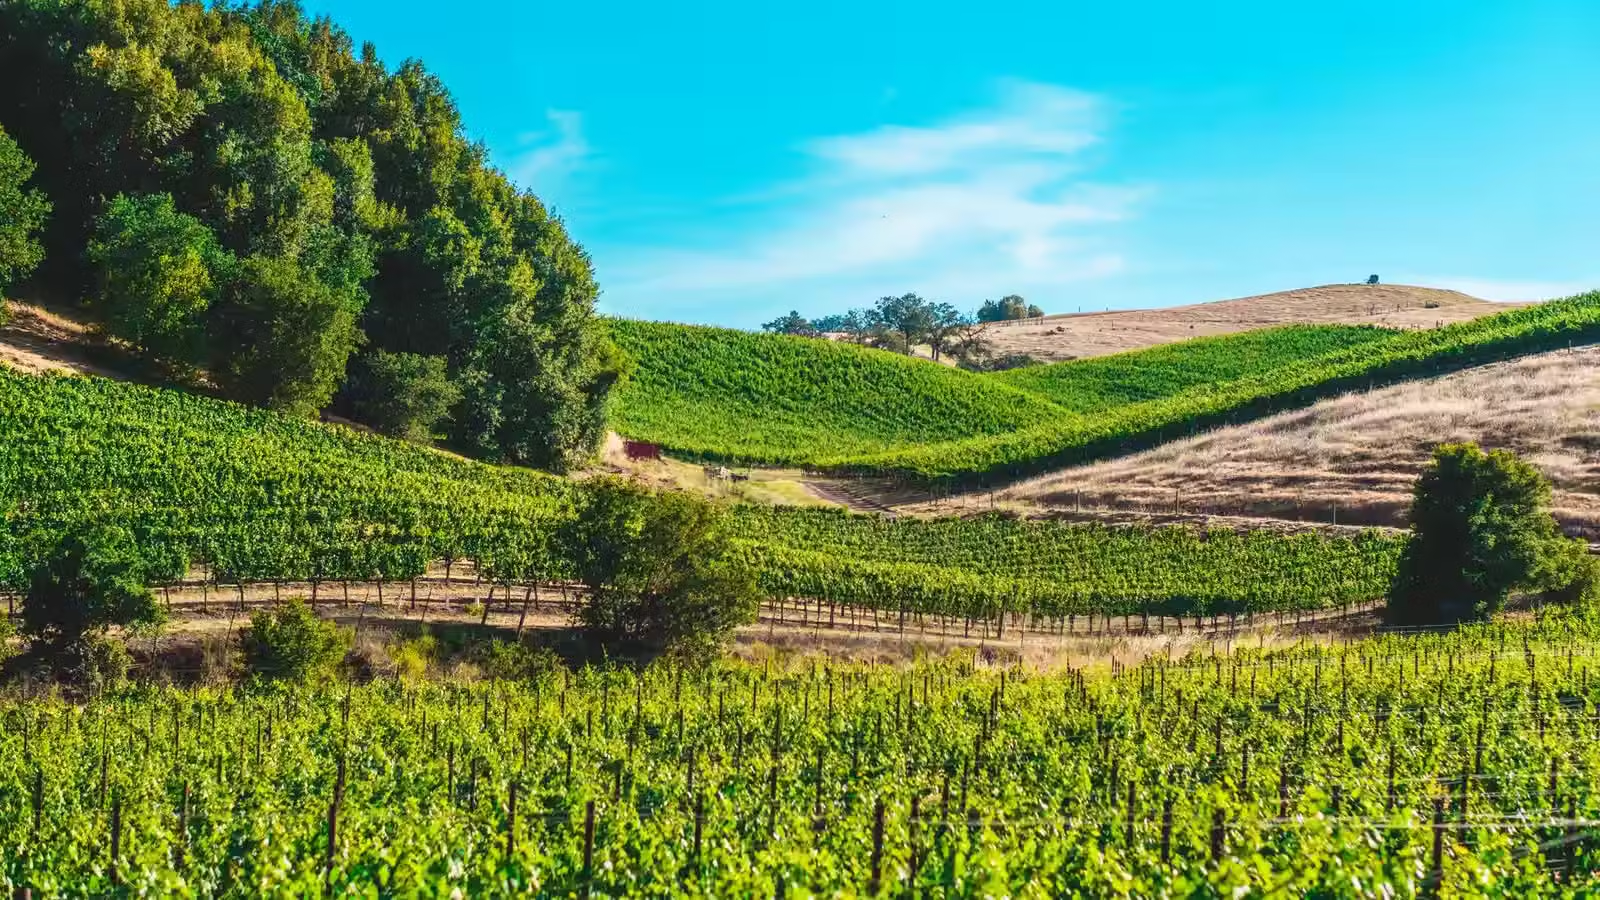
Cold air pools at the bottom of the slope. Without plot-level measurement there is no way to know where.
Frost alerts and separate data per plot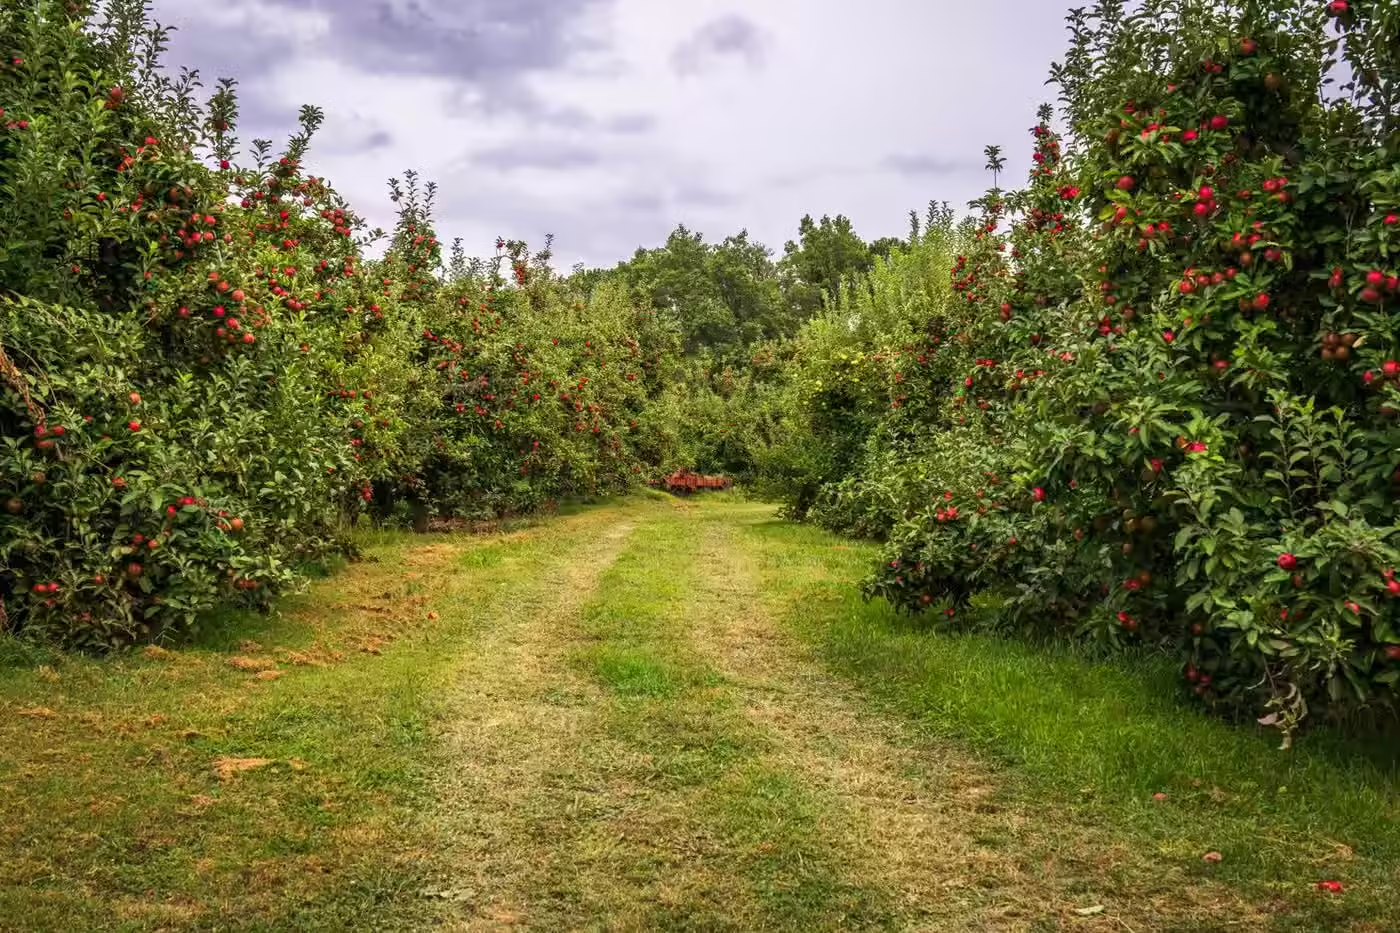
The difference between a lost night and a saved one is measured in minutes of warning.
Frost warning ahead of time, leaf-wetness hours on record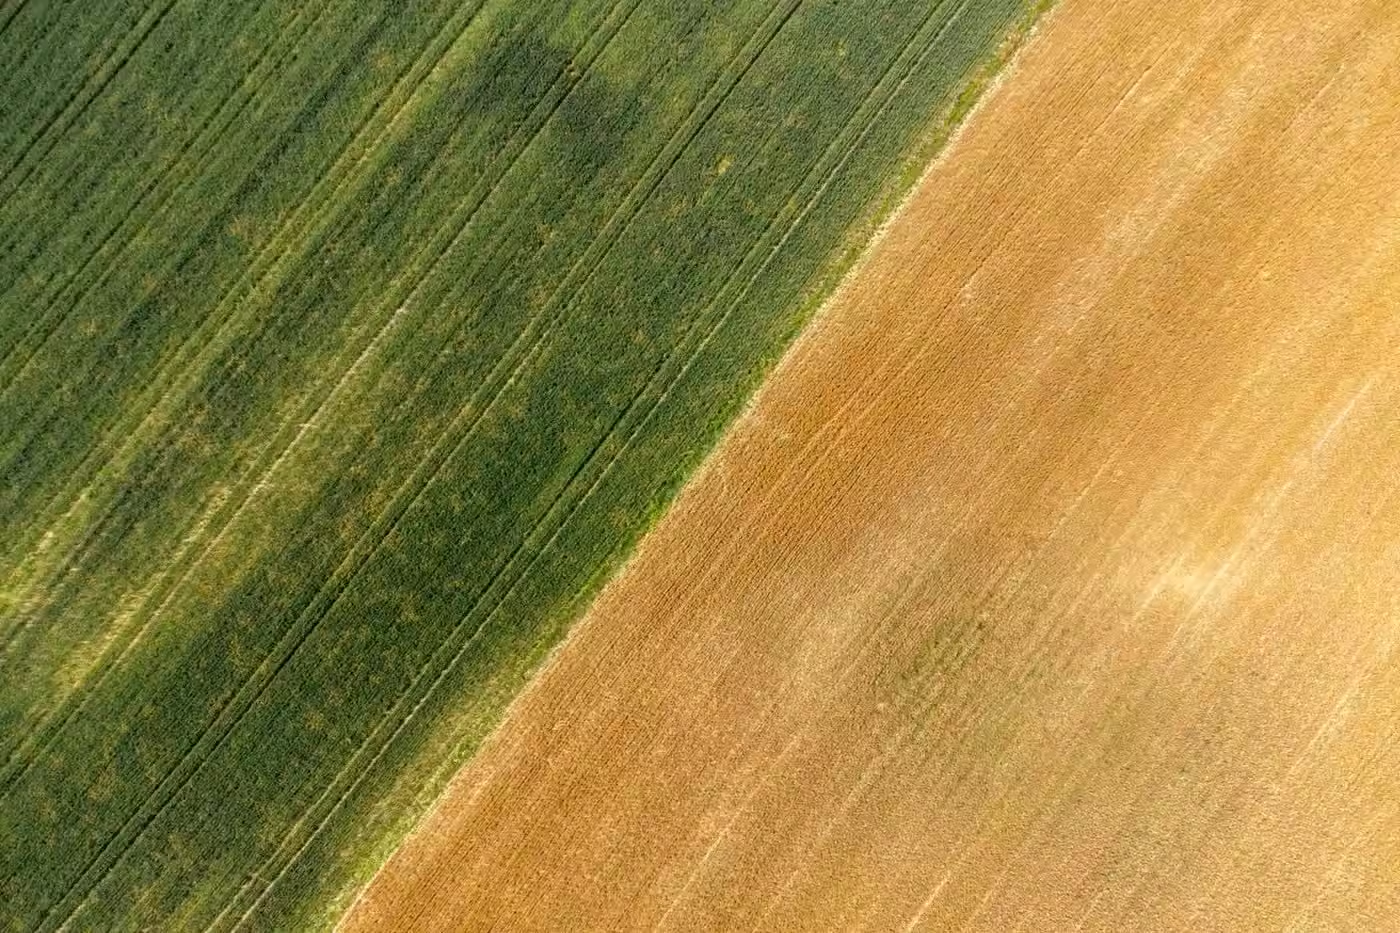
The irrigation schedule starts from the state of the soil, not from the calendar.
Per-field water balance, with ET₀ and drought indices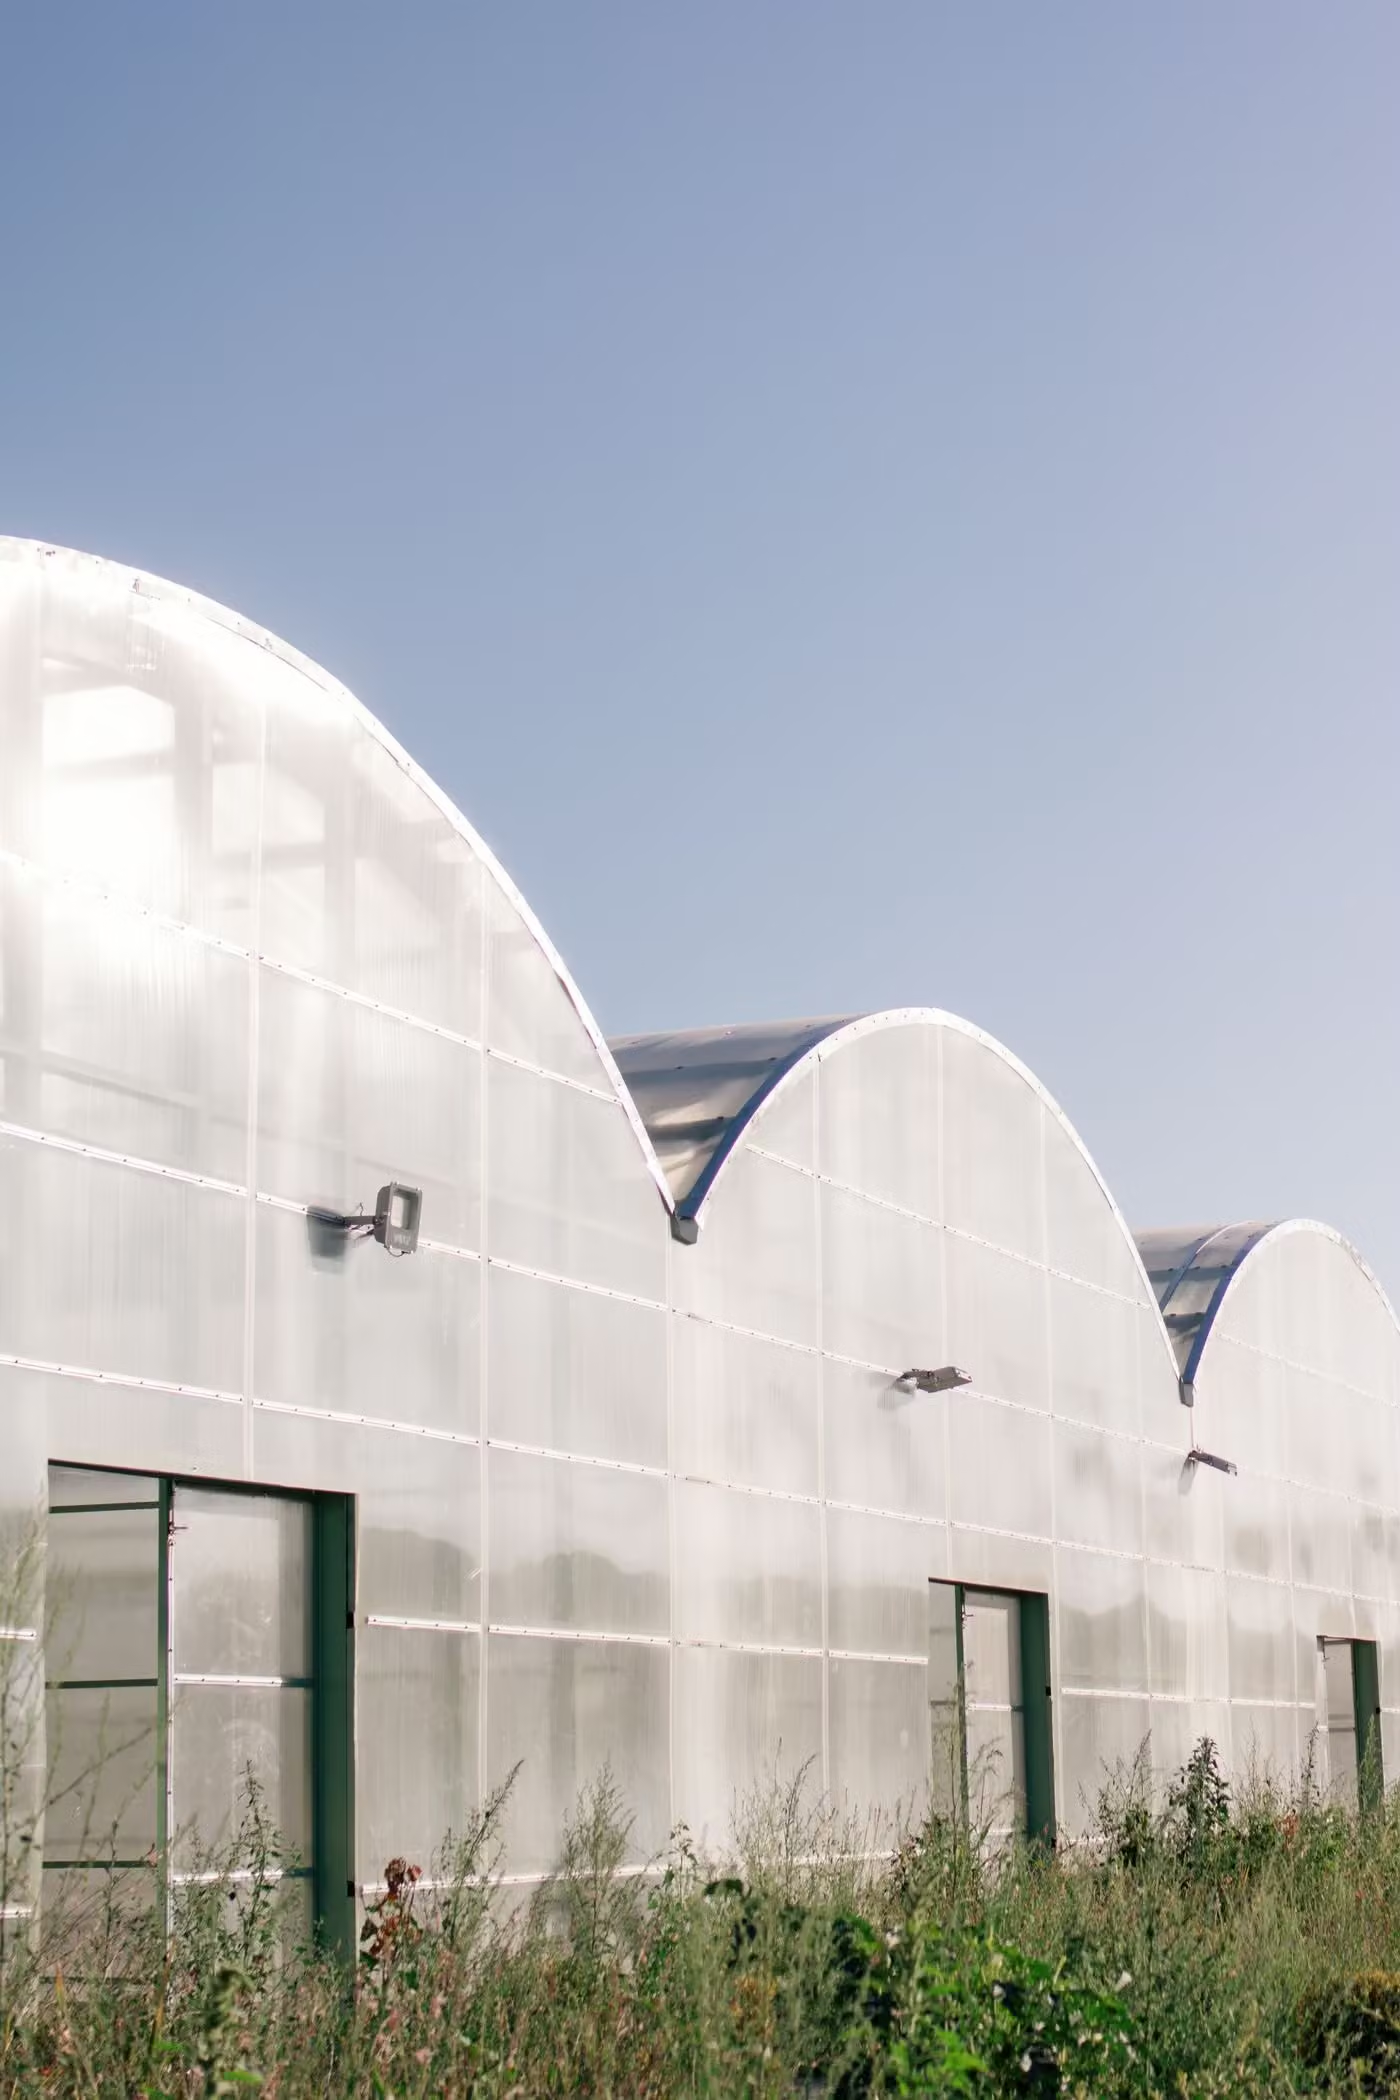
An air sensor where the weather station cannot reach, under the film.
Temperature and humidity measured inside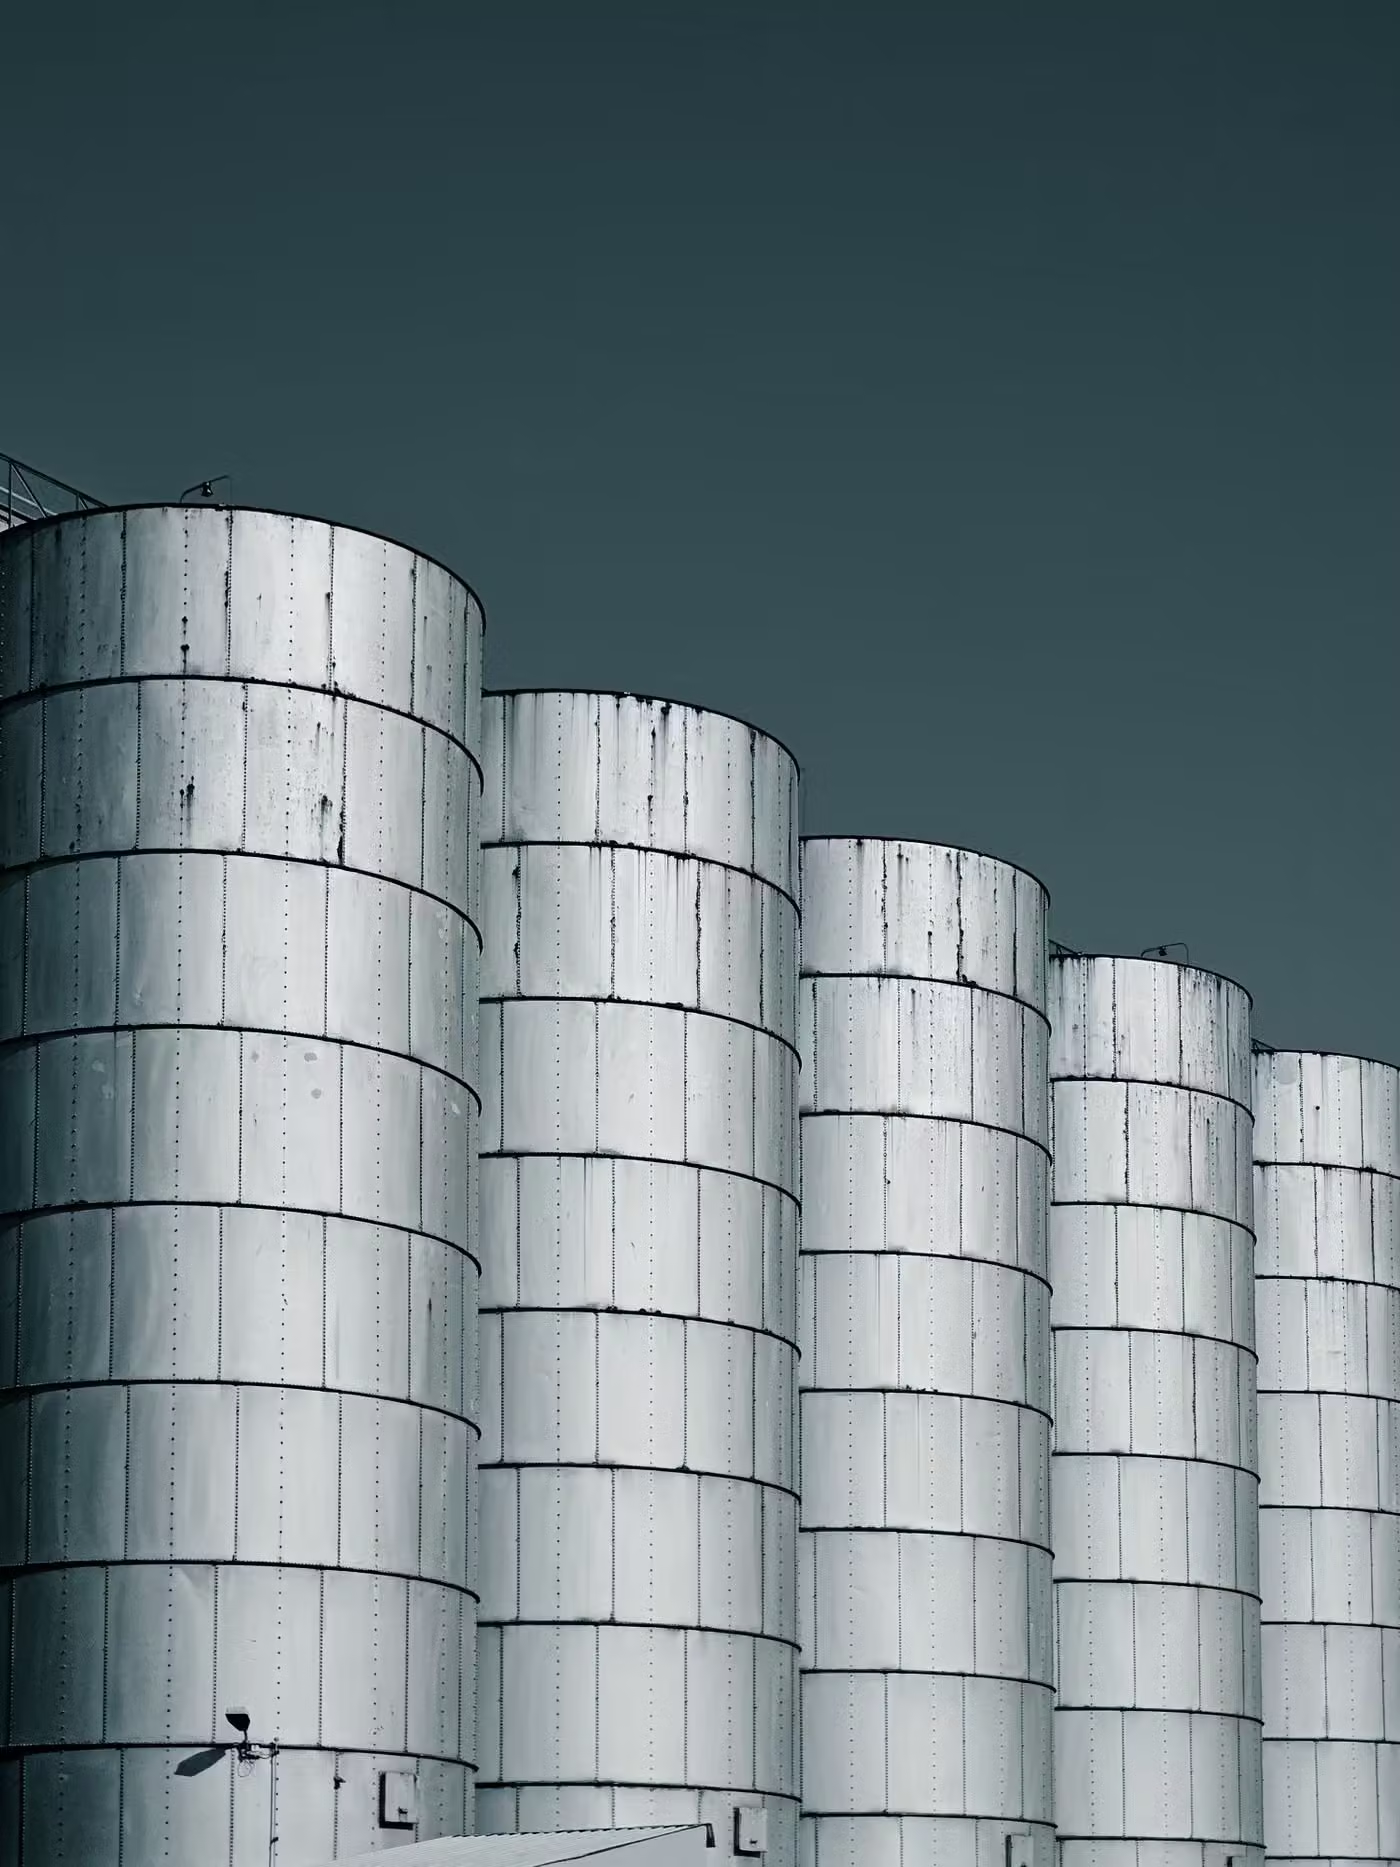
The same temperature and humidity readings, in the storage space.
Continuous monitoring in the storeFour product decisions you can verify yourself, not four promises.
Export at any time. No lock-in on the history you paid to collect.
Every derived metric shows its formula in the app. You can check the number instead of just believing it.
Solar gateway, sensors on batteries. Installation does not depend on a power line reaching the plot.
SenseCAP and LoRaWAN, no proprietary protocol. You can buy a spare sensor anywhere.
We do not publish testimonials until we have a full season of data behind them, with the name of the farm and the crop. When they exist, they appear here.
With line of sight between gateway and sensor, the usable range is 8 to 12 km. Over gentle hills or through a mature orchard it drops to 3 to 5 km. In dense forest or between buildings it can fall to 1 to 2 km.
On large farms we mount the gateway on a pole or a silo at 8 to 15 m, which covers most situations from a single central point.
It depends on the reporting interval. At 10 minutes, the standard weather station profile, a lithium thionyl chloride battery lasts 5 to 6 years. At 15 minutes, typical for a soil sensor, 4 to 5 years. At 1 minute, an aggressive profile that is rarely needed, it drops to a year or a year and a half.
Batteries are user-replaceable with a standard pack; you never have to send the device back.
It keeps running. The gateway draws around 5 W, roughly 120 Wh per day, and the 12 V/100 Ah LiFePO4 battery provides about 1 150 usable Wh. That works out to roughly nine days of full autonomy with no contribution from the panel at all.
The 100 W panel only has to cover the daily consumption, not recharge the battery from empty, even in winter it manages that in a few hours of usable light.
Every location is automatically paired with the nearest station of the Romanian National Meteorological Administration. In the app you see the official station’s measurements next to your own sensors, which helps with validation and with any situation where a reading has to be defended to a third party.
We also pull the official meteorological warnings issued for your area from the same source; they appear as alerts in the platform, alongside your own threshold rules.
The hardware is yours once you buy it. For the dashboard, data processing and email alerts there is an annual subscription covering hosting, technical support and updates. There are no per-message or per-sensor charges.
For farms that want full control of their data we also offer a self-hosted deployment on your own server, with no recurring subscription.
Yes, through an API to standard controllers (Netafim, Rain Bird, Valley) over the usual protocols, Modbus or REST.
We recommend starting in passive mode, with alerts and recommendations, and moving to automated control only once the operator trusts the data.